Canvas Charts in React Native
Introduction
Charting libraries in React Native aren’t well suited for plotting lots of data or streaming data at a high frequency. Common libraries such as Victory Native, react-native-svg-charts, and react-native-pathjs-charts are mostly SVG based, and performance is very bad for anything other than displaying a static chart of a hundred or so points.
React Native Charts Wrapper is a wrapper around the native charting libraries MPAndroidChart for Android and Charts for iOS, the latter of which I’d enjoyed using in a native iOS project some years ago. I expect performance is significantly better than the SVG options, but at the expense of additional installation steps due to the use of native code. In addition, matching styling of these charts on other platforms (e.g. web) would add effort if consistency was desired. I really wanted to find a solution that minimized the use of native code, could share styling and configuration with a web-based implementation, and was performant enough to plot thousands of data points simultaneously, and plot data streamed at 60 FPS.
Given the above constraints, it seemed to leave two main options.
The first is charting using SVG Elements Directly. Building SVG Line Charts in React is a detailed blog post that describes how to do this. This approach can be extended to React Native with react-native-svg. It seemed possible to get performance gains over existing SVG based libraries by creating a custom solution, although it wouldn’t be particularly easy and would still be subject to the same limitations as the existing SVG-based plotting libraries. One user in the Reddit post Is it possible for react native, to render a line chart every 10-15ms to stream real time data (e.g. Sensor Data)? seemed to have good success. However, it wasn’t obvious that this approach would meet the performance requirements that I was looking for.
The second approach is to use one of the many canvas-based charting libraries. I’ve used several of these before on the web and found the performance to be very good, supporting plotting well into the thousands of points. Being able to adapt one of these libraries to React Native would make the generation of consistent plots across web and mobile easier. Using canvas charts in React Native was the approach I decided to take.
There were a few implementations such as clchart and react-native-chartjs, both of which were small projects that didn’t seem to be widely used or actively maintained.
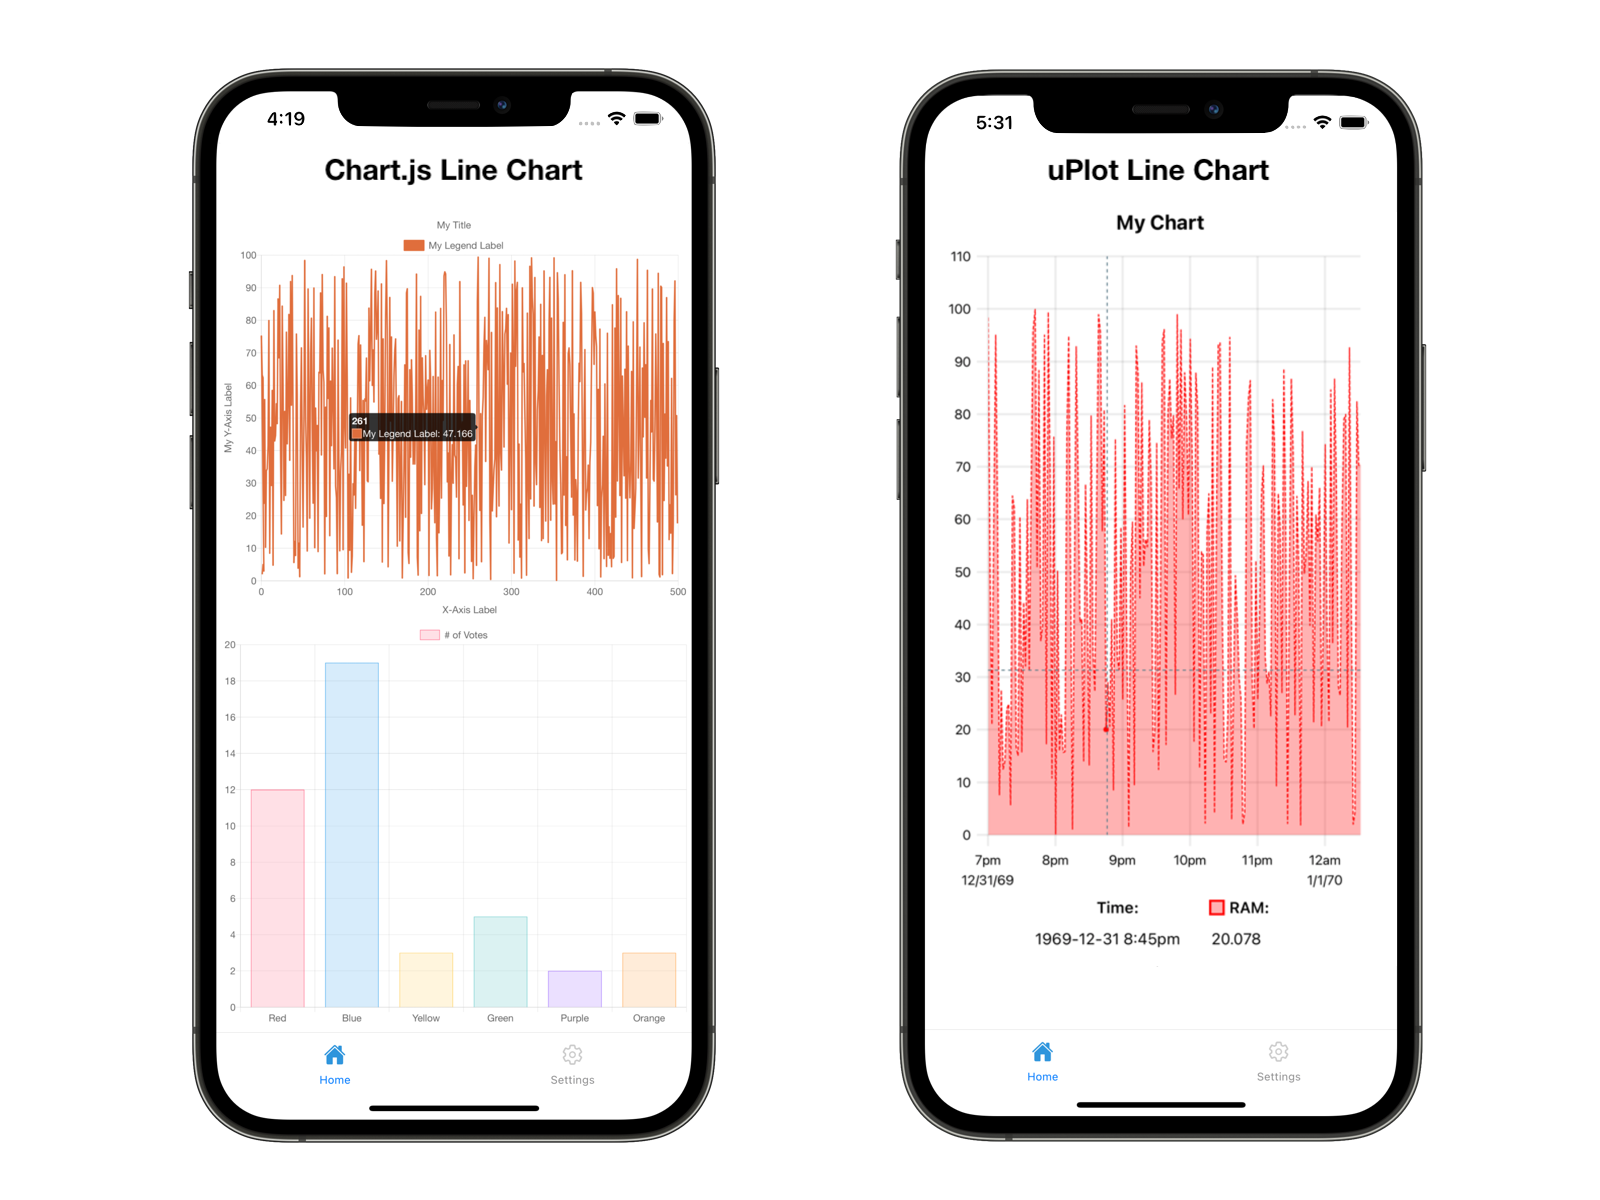
I decided to use Chart.js which I’d used before with success and implement it inside of a React Native WebView.
It’s not the most performant of the canvas-based charting libraries, but is decent and easy enough to use.
The implementation below should be easily extensible to support other canvas-based plotting libraries in React Native.
Note that the sample code below uses Chart.js 3, which is still in Beta at the time of this writing.
Minimal Implementation
The only dependency was react-native-webview to allow the canvas element to be created in the web view.
This did require native code, but the installation process was very easy.
Within moments I was able to copy-and-paste a simple sample chart from the web and generate a chart with thousands of points in a React Native app using the code below.
|
|
However, this initial minimal implementation has many drawbacks. The CDN (and thus internet connectivity) is relied to fetch Chart.js, there is a massive multiline template literal of HTML cluttering up the component, and data is not easily passed to the component and plotted.
Improved Implementation
As a first step, the multiline template literal of HTML can be moved to another file, at least tidying up the component:
|
|
Within index.html the Chart.js script as fetched from the CDN can be replaced with its contents, ensuring the component will work without internet connectivity:
|
|
I’ve not yet found a way to import Chart.js directly into this HTML.
That the HTML can be specified as a string in the WebView props as source={{ html: '<html>' }} offered one possible solution.
In this case, the HTML string can be specified as a string template, and string interpolation used to insert some JavaScript.
However, this presents difficulties when the inserted JavaScript uses backticks, and still requires the JavaScript to be inserted live somewhere as a string.
Ideally, in the same way that the HTML can be required and passed to the WebView’s source prop, additional required JavaScript could be passed as additional props.
Other than that the Chart.js dependency has been copy-pasted into the otherwise empty index.html file, being committed to the projects source and causing a minor inconvenience when updating the library version, the solution overall isn’t too terrible.
The rest of the HTML is also pulled out into component code and the config passed in there, thus allowing the chart to be configured as desired without needing to modify index.html.
This includes the creating of the canvas element that needs to exist in index.html.
The WebView’s ref is then used to inject the JavaScript to create the canvas element and a new Chart with the chart configuration.
The updated index.html shown above can then be included and used:
|
|
Because data is written to the WebView as a JavaScript string, when passing data or a chart configuration object, JSON.stringify() needs to be called on it.
Now the implementation is getting more manageable.
index.html is basically an empty file with the Chart.js library pasted in, and the chart configuration is conveniently defined as an object in the component where the chart is.
To further keep the component uncluttered, and given the relatively large size of the Chart.js configuration object, the config can be moved to a separate file and imported.
This can be taken a step further by wrapping the WebView in a custom ChartJs component so that the chart config can be conveniently passed in as a prop:
|
|
This can then be conveniently used as:
|
|
This custom component can accommodate style props as well.
This provides very basic implementation of a wrapper around a React Native WebView to use the Chart.js canvas-based library.
The result is a convenient component that can simply receive the chart config as a prop and plot the contained data.
Real-time Plotting
However, if the chart data needs to be frequently updated, the only way to do that is via this config prop, causing re-render each time the plot needs to be updated.
This is not a performant approach to update the plot at 60 FPS.
Updating Chart data with Ref
Exposing a ref to the parent component can be used to draw to the canvas element without requiring a re-render of the child each time.
Because the component wrapping the WebView is a function component, reading the React Docs Refs and Function Components gives some relevant information:
If you want to allow people to take a ref to your function component, you can use
forwardRef(possibly in conjunction withuseImperativeHandle), or you can convert the component to a class.
See the React Docs on useRef, Forwarding Refs and useImperativeHandle for more information.
The use of useImperativeHandle allows setData to be called by the parent component that renders ChartJs to update the plotted data without re-rendering ChartJs.
|
|
The ChartJs component above with this ref can then be used to plot new data without needing to pass new config prop and triggering a re-render:
|
|
Fixing Jest
While the above implementation was working well, Jest will break as it will try to parse the HTML file (which lives within src) as JavaScript, giving the following error.
Jest encountered an unexpected token

This usually means that you are trying to import a file which Jest cannot parse, e.g. it's not plain JavaScript.
This was a quick fix to mock the HTML file as an empty object.
Create the file <rootDir>/__mocks__/fileMock.js with the following contents:
|
|
and in jest.config.js use this mock:
|
|
This at least offers a solution to fix failing tests simply due to the presence of the HTML file.
It may be necessary to find a better solution in the future if tests are actually added to the ChartJs component.
Conclusion
This post provided a minimal implementation of the canvas-based plotting library Chart.js in React Native.
I hope to find a more elegant solution for including JavaScript dependencies that are needed within the WebView, but for now I am reasonably satisfied with this solution.